Multi-Channel Revenue & Ads Dashboard (Excel & Google Sheets)
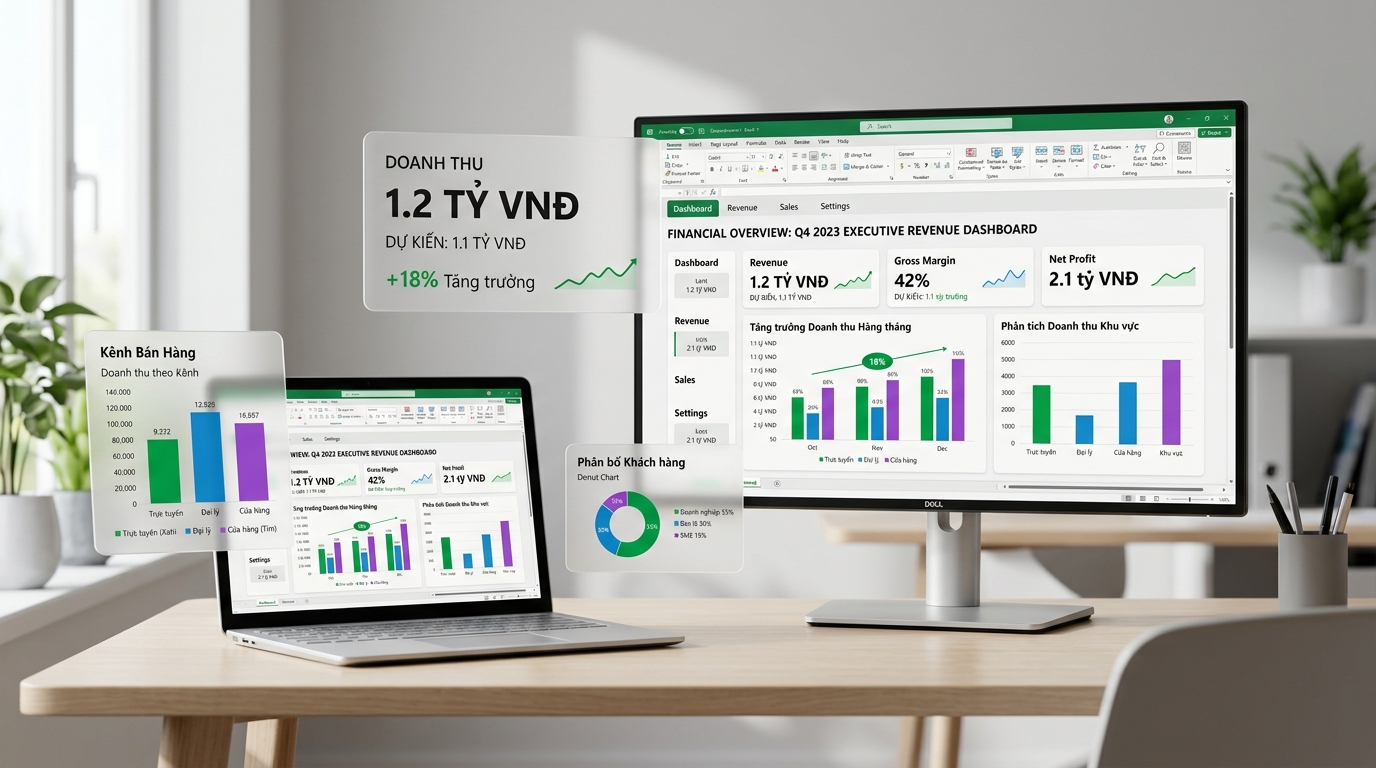
Business Outcome:Fluent 2 inspired analytics dashboard for Google Sheets & Excel. Consolidate revenue, COGS, net margin, and ad spend (Facebook/Google/TikTok Ads) with real-time ROAS/ROI and channel filters.
Setup Time5 mins
DifficultyVery Easy (Beginner)
Running Cost0 VND
Versionv1.2 (Latest)
Package Deliverables
Excel .xlsx template
Google Sheets copy link
Data import video guide
3-Step Deployment Flow
Step 01
Download / Confirm
Receive your workflow download link instantly via email and Account Downloads after checkout.
Step 02
Import & Connect Keys
Import the JSON template into n8n or copy the Google Sheet and paste your API credentials.
Step 03
Activate Automation
Toggle Active on—your workflow runs 24/7 automatically and sends notifications on schedule.
Detailed Solution Architecture
REVENUE ANALYTICS • MICROSOFT FLUENT 2 DESIGN
1. Executive Dashboard Overview
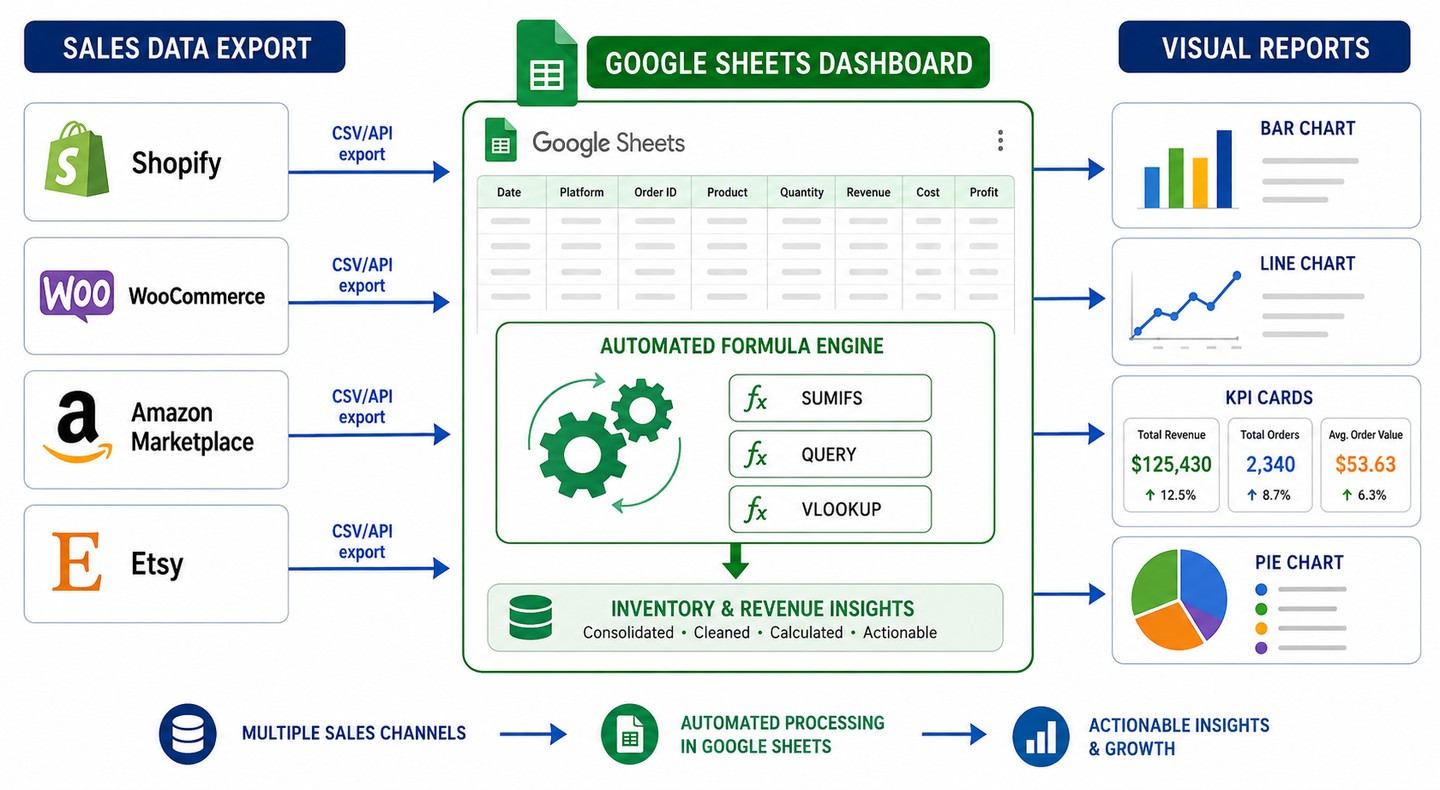
If you sell across Website, Shopee, TikTok Shop, Lazada, and retail stores and struggle to reconcile numbers at month-end, the Multi-Channel Revenue Dashboard turns raw CSV exports into crisp financial visibility in minutes.
Consolidating marketplace and web order exports into one executive view
2. Tracked KPIs
Gross vs. Net Revenue: Separates cancellations, returns, and marketplace fees cleanly.
COGS & Gross Margin: Monitor unit economics across SKUs and channels.
Ad Spend & ROAS/CPO: Measure true return on ad spend and cost per order.
Channel Mix Charts: Interactive breakdowns by storefront and campaign period.